
When we evaluate our past bets, most thoughtful bettors are looking at some combination of their actual results and their closing line value.
CLV is useful because it stabilizes much more quickly than actual results. Return on investment is what we’re all playing for, but how can we strip the luck out of actual results? How can we use results in a manner similar to CLV to be more predictive, more quickly? Basically, how can we de-luck our actual performance?
If you bet college basketball like I do, you probably bitch and moan about poor overtime luck, losing close games, and all sorts of other events where we’re on the wrong side of variance.
For example, say you bet Under 143 in a college basketball game. It goes to overtime tied 60-60 but finishes at 146. You feel like you were on the right side of the game and were unlucky. I can look at “overtime flips” as a way to de-luck my results. In other words, how the bet would have been graded if it didn’t go to OT. I do the same thing with extra inning results in baseball.
How we do in games that fall within a point or two of the spread is pretty random, and if I’m returning 15 percent on those games, I expect that I’ve been lucky.
If I’m returning negative-15 percent, I’ve been unlucky. But how lucky? And how can I extend that rudimentary analysis to other games? Surely, if I’m returning 20 percent on games that fall 3-4 points from the spread, I’ve also been on the right side of variance.
I have a simple, intuitive way to re-grade your bets in a way that is more indicative of how you should have performed based on the results of the games you bet. I call it expected ROI, or xROI.
We assume the score at the end of regulation was our best prediction going into the game. In other words, we’re treating the final results as our closing line. How often would we expect our bet to win if that were the case?
Putting Together xROI with Alt Lines or Distributions
Here’s an example from Saturday.
I bet on Oregon -6.5. They won the game by 2 points. How often would a 2-point favorite be expected to win by 6.5 points? 34 percent of the time.
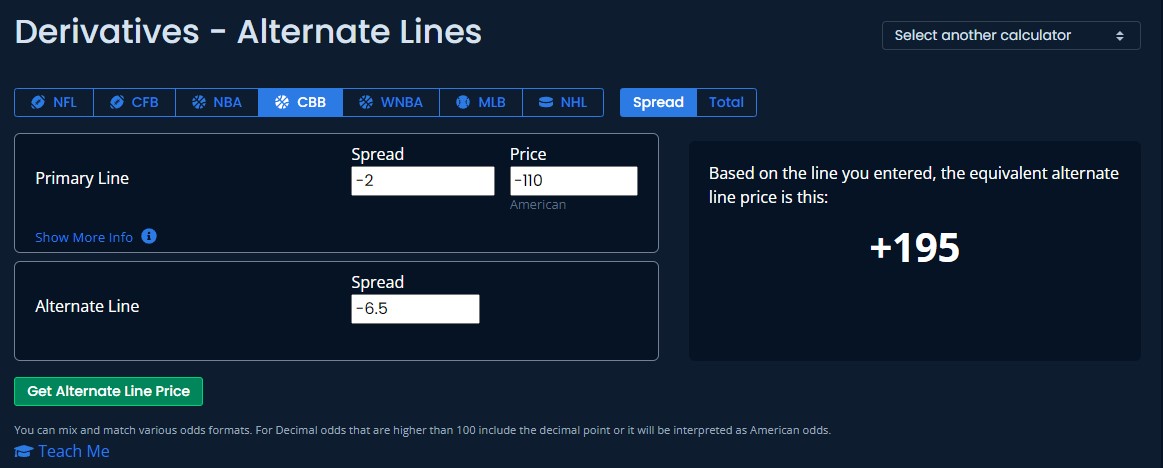
My bet lost (which gives us a healthy -100 percent ROI) but my xROI was -35 percent assuming I bet it at -110.
I also bet Oregon on the moneyline at -285, yielding an actual return on investment of 35 percent. How often would we expect a 2-point favorite to win the game outright? The implied probability of a -285 moneyline is 74 percent. Using the Alternate Lines Calculator, the equivalent moneyline to a -2 favorite is -135, or an implied probability of 57 percent.
So while I made money on the bet, my xROI was actually -23 percent.
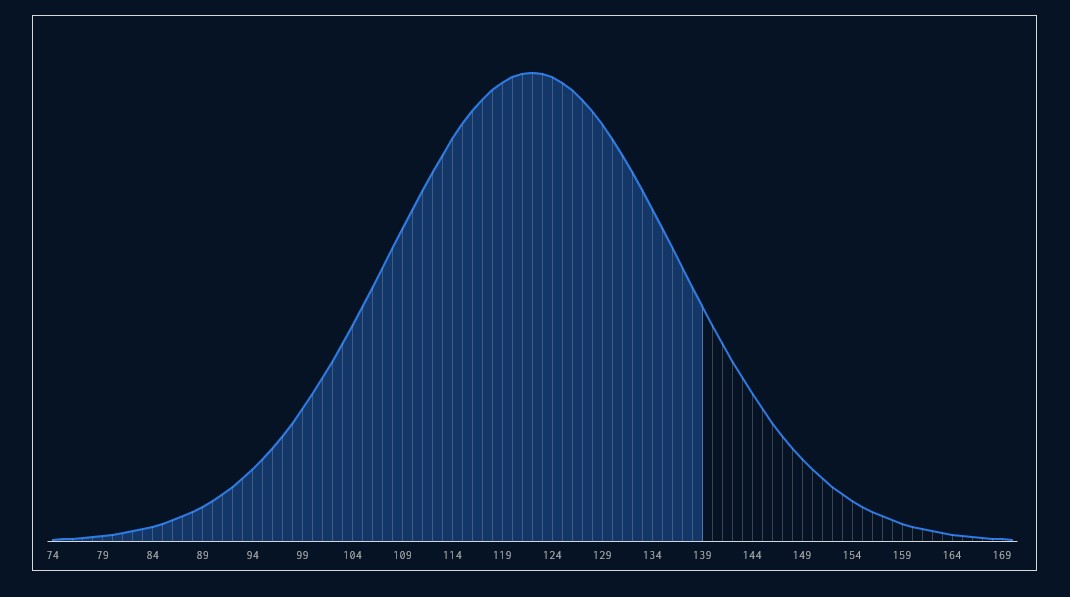
One more example: I bet on Northwestern/Minnesota Under 139 on Feb. 3. The score was 61-61 at the end of regulation, but ended with Minnesota winning, 75-66, in overtime. A game totaled at 122 would be expected to stay under 139 around 88 percent of the time.
The formula we can use here is: xCOVER%*(Even money/betting odds)-(1-xCOVER%)
First, let’s back that up.
To get your xCOVER%, you can use the Alt Line Calculator like the one at Unabated, but it’s even easier to assume a normal distribution centered around the final results. Your standard deviation is based on the historical distribution of game outcomes around the point spread (or total).
Then use your spreadsheet’s NORM.DIST() function. The standard deviation I used in this case is 14.5 points.
xCOVER% = NORM.DIST(139,122,14.5,true) = 87.95 percent
Now we can go back to get our xROI. Our xCOVER% is 88 percent or 0.88. Even money divided by our betting odds are 1/1.1. And 1-xCOVER% in this case is 1-0.88 or 0.12.
So my xROI would be 0.88*(1/1.1)-0.12 = 68 percent
Now we have a pretty straightforward way to quantify our results in a way that’s more predicative and arrives at a “true” outcome faster than just counting up our actual ROI.
A Few Notes
- Overtimes change this a little bit. You can make things somewhat more complex to account for that. However, if you are balanced between betting Overs and Unders, this is close enough. It’s close enough for my purposes.
- I realize there are many things you can do to strip luck out of the outcome of any sporting event. Bill Connelly does a great job of this in college football with his postgame win expectation. This isn’t intended to do that. This is the most simple version using just the game’s final score in order to be a better predictor of future ROI than actual ROI.
- You can go more in-depth and use something like what we do for Massey-Peabody game grades, or what Bill Connelly does, and generate an expected final score that strips out luck. You could also make some very simple adjustments to the final score (by stripping out fumble recovery luck in NFL games, for example). But this framework still should apply.
- This is one I’ve been thinking more and more about. You can also adjust your standard deviation parameter in the normal distribution to reflect less uncertainty in game outcome compared to what we’d get using the distribution of game results around a closing spread or total. I do believe this method outlined above will understate your ROI a bit if you’re a winning bettor for that reason. I’m going to do some fiddling to see if there’s an adjustment that’s most optimal to predict future ROI.
Want to see how other bettors are applying concepts like this? Drop into the Discord. Need an introduction to more fundamental concepts? Sign up for one of our demos and get a 5-day trial to Unabated Premium!